Using Machine Learning in the Cloud to Improve Driver Safety
One of our customers partners with car manufacturers to include connected vehicle and road condition data in navigation systems to improve driver safety. The company aggregates, curates, and applies machine learning to near-real-time data, providing predictable, time-based road segment analysis with the goal of improving road safety, reducing vehicle emissions, and decreasing traffic congestion to create a better world. They invited Lineate to build a geospatial analysis platform for data scientists to design and refine machine learning algorithms and visualize their trained models. This platform could also demonstrate all of their capabilities to clients and potential investors (for example, car manufacturers). With these goals in mind, we built a product, which combines artificial intelligence with various data (such as road curvature and weather conditions) to create a road safety indicator that works in near real time for each segment of the road of interest. This indicator gives car manufacturers the data needed to create autonomous driving systems.
Share:
Service:
- Cloud Strategy and Migration
Got a project?
Harness the power of your data with the help of our tailored data-centric expertise.
Contact usShare:
Service:
- Cloud Strategy and Migration
Got a project?
Harness the power of your data with the help of our tailored data-centric expertise.
Contact usProblem
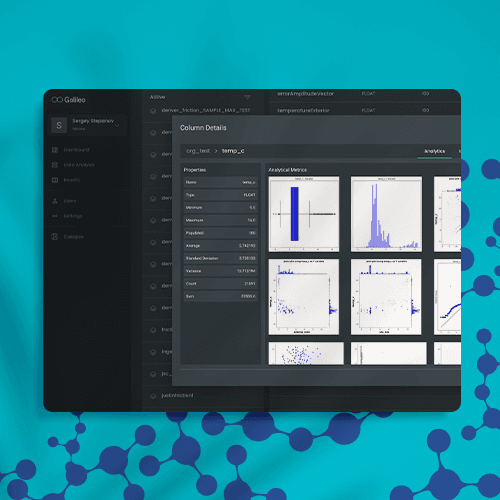
Originally, our client had a limited set of data science tools using JupyterHub notebooks. These tools could be utilized by only very tech-savvy users and didn’t provide an interactive way to experiment with the various models being created. Our client also wanted the capability to visualize the data in geospatial terms, to drill down and cross-reference the data, and to demonstrate the full power of the company’s machine learning models.
In addition, the processes around data management (uploading, curating, and productizing) were manual and therefore labor intensive and error prone. The new system needed to make the AI data pipeline simpler and more reliable.
Solution
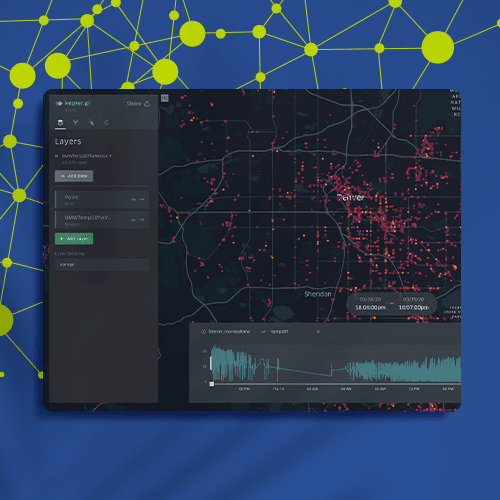
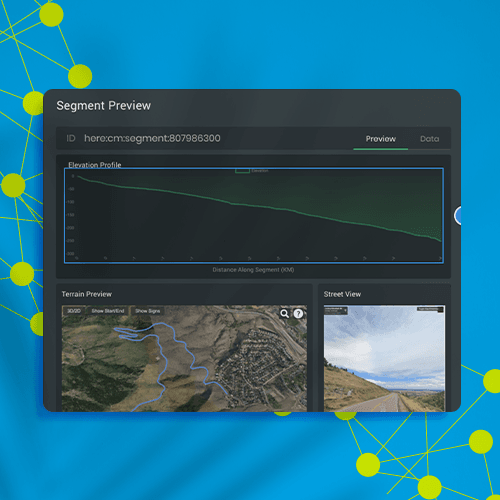
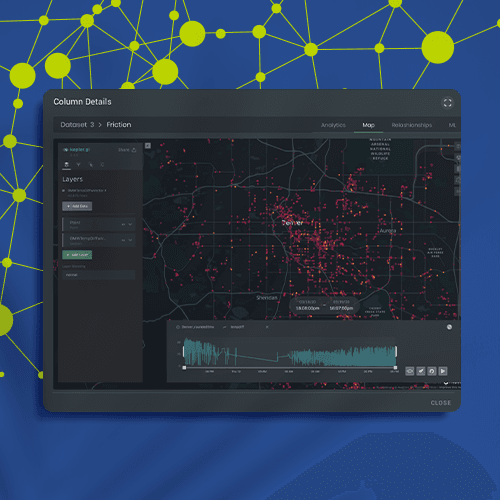
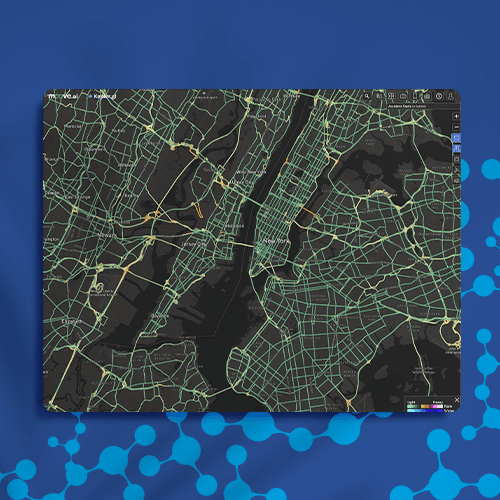
Lineate built a new data visualization product that is integrated with their data processing platform that applies scoring models to real maps to see how different features affect the road safety score. Users can build routes over various time periods and “replay” historical weather and other road conditions, then see how different scoring models could affect the safety and route planning for a given time period.
We also provided a data backbone to connect all the required disparate data. Collaborating with the our client’s data science team that handles data preparation and extract, transform, load (ETL), we built the modeling formula based on input from their data scientists and applied coefficients to different fields during data transformation steps, handling large data sets in a timely and cost-efficient manner.
Our team helped to gather and prepare data for car-crash data set analysis. The goal was to figure out which factors (such as weather, sun position, and car behavior) correlate to the probability of a car accident. After the correlations were calculated, we applied those coefficients to real-world conditions (such as road slope, turns, time of day, and current weather) and calculated a "safety score" for the current time for a given road segment. We then overlaid these scores on the interactive map. The scoring API was built on top of a partitioned Google BigQuery database.
Result
The customer’s system is having a positive impact on people and the environment. Our client helps navigation systems route users around roads and road segments that might have safety issues given certain conditions, such as weather, time of day and sun position, or heavy traffic. This data can also be used to create routes that are more efficient in terms of time and distance or routes that require less starting and stopping, thus lessening emissions.
As we worked closely with our client to build this product, we found that the data itself is fascinating. For example, we learned that the direction of the sun has a huge effect on road safety, outweighing weather and other factors, and that left turns in general are more dangerous than even bad weather conditions. The customer systems help users to explore these facts, cross-reference them with other safety factors, and draw further conclusions that can lead to better safety features in cars and driverless automation.
Tech stack
Because it was so critical to rapidly innovate and test new hypotheses, we made the decision to use the serverless features of Google Cloud. Using this platform helped us to write algorithms and analyze maps without the heavy deployment of code. We were able to download the entire country’s weather data, normalize it, integrate it with road graphs, and execute machine learning scoring within 15 minutes. By analyzing hot spots on the map, we could perform grid optimization and were able to optimize service use and costs in a flexible way.
Our approach was to make the user experience and data processing aspects of the platform seamless. By using React and GraphQL on the front end and BigQuery and Kubernetes-based Google Cloud infrastructure on the back end, we were able to get to market quickly and rapidly improve the platform.
Frontend: React/Material UI, Typescript, GraphQL, Apollo (GraphQL client), Jest testing, framework, Autho Authentication, Kepler.gl, Vue.js, Mapbox .
Backend: Nest.js (Node.js framework), Google Cloud APIs, Google Cloud Functions as a serverless code execution env, Google Cloud Storage, BigQuery, Google Composer, Prisma - GraphQL ORM, PostgreSQL, Docker, Kubernetes, Python, Jupyter Notebooks for machine learning